A IO thread and a worker thread walk into a bar: a microbenchmark story
A competitor recently published a microbenchmark comparing the performance of their stack to Quarkus. The Quarkus team feels this microbenchmark shouldn’t be taken at face value because it wasn’t making a like-to-like comparison leading to incorrect conclusions. Both of the two frameworks under comparison support reactive processing. Reactive processing enables running the business logic directly on the IO thread, which ultimately performs better in microbenchmark focusing on response time and concurrency. The microbenchmark should have been written so that both frameworks (or neither framework) obtain this benefit. Anyway, this turns out to be a very interesting topic and good information for Quarkus users, so read on.
tl; dr;
Quarkus has great performance for both imperative and reactive workloads. It’s because Quarkus is itself based on Eclipse Vert.x, a mature top performing reactive framework, in such a way that allows you to layer, mix and match the IO paradigm that best fits your use-case.
If you have a REST scenario well suited to run purely on the IO thread, add a Vert.x Reactive Route using Quarkus Reactive Routes and your app will get better performance than using Quarkus RESTEasy.
We ran this low-work REST + validation competitor-written microbenchmark which features no blocking operation, just returning static data. When using Quarkus Reactive Routes to run Quarkus purely on the IO thread, we observed 2.6x times the requests/sec and 30% less memory usage (RSS) than running with Quarkus RESTEasy (which mixes IO thread and worker thread). But that’s on a microbenchmark purpose built to this specific scenario (more on that later).

More interesting read
The microbenchmark itself is uninteresting, but it is a good demonstrator of a phenomenon that can happen in reactive stacks. Let’s use it as a vehicle to learn more about Quarkus and its reactive engine.
Imperative and Reactive: the elevator pitch
This blog post does not explain the fundamental differences between the imperative execution model and the reactive execution model. However, to understand why we see so much difference in the mentioned microbenchmark, we need some notions.
In general, Java web applications use imperative programming combined with blocking IO operations. This is incredibly popular because it is easier to reason about the code. Things get executed sequentially. To make sure one request is not affected by another, they are run on different threads. When your workload needs to interact with a database or another remote service, it relies on blocking IO. The thread is blocked waiting for the answer. Other requests running on different threads are not slowed down significantly. But this means one thread for every concurrent request, which limits the overall concurrency.
On the other side, the reactive execution model embraces asynchronous development models and non blocking IOs. With this model, multiple requests can be handled by the same thread. When the processing of a request cannot make progress anymore (because it requests a remote service, or interacts with a database), it uses non blocking IO. This releases the thread immediately, which can then be used to serve another request. When the result of the IO operation is available, the processing of the request is restored and continues its execution. This model enables the usage of the IO thread to handle multiple requests. There are two significant benefits. First, the response time is smaller because it does not have to jump to another thread. Second, it reduces memory consumption as it decreases the usage of threads. The reactive model uses the hardware resources more efficiently, but… there is a significant drawback. If the processing of a request starts to block, this gets real bad. No other request can be handled. To avoid this, you need to learn how to write non blocking code, how to structure asynchronous processing, and how to use non blocking IOs. It’s a paradigm shift.
In Quarkus, we want to make the shift as easy as possible. However, we have observed that the majority of user applications are written using the imperative model. That is why, when the user application uses JAX-RS, Quarkus defaults to execute the (imperative) workload to a worker thread.
Hello world microbenchmark: IO thread or worker thread?
Back to the competitor’s microbenchmark, we have a REST endpoint doing some trivial processing and some equally trivial validation. Pretty much no meaningful business work. This is the Hello World of REST for all intents and purposes.
When you run the microbenchmark with Quarkus RESTEasy, the request is handled by the reactive engine on the IO thread but then the processing work is handed over to a second thread from the worker thread pool. That’s called dispatch. When your microbenchmark does as little as Hello World, then the dispatch overhead is proportionally big. The dispatch overhead is not visible in most (real life) applications but is very visible in artificial constructs like microbenchmarks.
The competitor’s stack, however, runs all the request operations on the IO thread by default. So what this microbenchmark was actually comparing is just the cost of dispatching to the worker thread pool. And frankly (according to the competitor’s numbers) and in spite of this extra dispatch work, Quarkus did very very well achieving ~95% of the competitor’s throughput today! I say today because we are always improving upon performance, and in fact we expect to see further gains in the soon to be released 1.4 release.
When compared at a disadvantage (dispatching to a worker thread), Quarkus is nevertheless almost as fast in throughput.
… But wait, Quarkus can also avoid the dispatch altogether and run operations on the IO Thread. This is a more accurate comparison to how the competitor' stack was configured to do as in both case, it is the user’s responsibility to ask for a dispatch if and when needed by the application. To compare apples to apples, let’s use Quarkus Reactive Routes backed by Eclipse Vert.x. In this model, operations are run on the IO thread by default.
@ApplicationScoped public class MyDeclarativeRoutes {

  @Inject
  Validator validator;

  @Route(path = "/hello/:name", methods = HttpMethod.GET)
  void greetings(RoutingExchange ex) {
    RequestWrapper requestWrapper = new RequestWrapper(ex.getParam("name").orElse("world"));
    Set<ConstraintViolation<RequestWrapper>> violations = validator.validate(requestWrapper));
    if( violations.size() == 0) {
      ex.ok("hello " + requestWrapper.name);
    } else {
      StringBuilder validationError = new StringBuilder();
      violations.stream().forEach(violation -> validationError.append(violation.getMessage()));
      ex.response().setStatusCode(400).end(validationError.toString());
    }
  }

  private class RequestWrapper {
    @NotBlank
    public String name;

    public RequestWrapper(String name) {
      this.name = name;
    }
  }

}
This is not very different from your JAX-RS equivalent.
Throughput Numbers
We ran the microbenchmark application in a docker container constrained to reflect a typical resource allocation to a container orchestrated by Kubernetes:
-
4 CPU
-
256 MB of RAM
-
and
-Xmx128mheap usage for the Java process
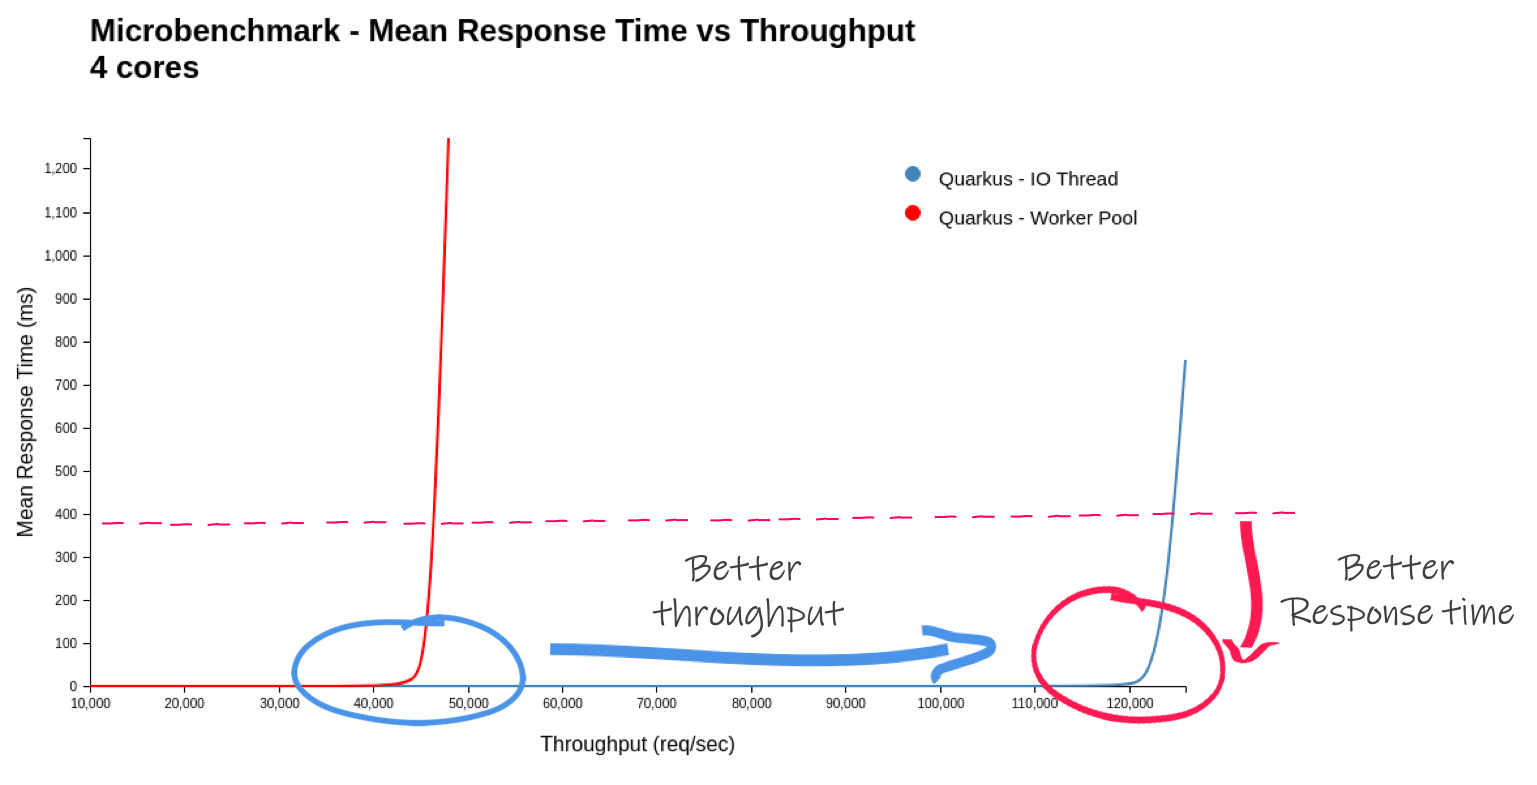
We saw that Quarkus using Reactive Routes ran 2.6 times the requests/sec. 2.6 times! It makes sense! Remember the application code virtually does nothing, so the dispatch cost is comparatively high. If you were to write a more real life workload (maybe even having a blocking operation like a JPA access and therefore forcing a dispatch), then the results would be very different. Context matters!
You can find code and how to reproduce the microbenchmark here on GitHub.
| Quarkus - 1.3.1.Final - 4 CPU’s | Worker thread | IO thread | Ratio |
|---|---|---|---|
Mean Start Time to First Request (ms) [1] |
993.9 |
868.3 |
87.4% |
Max RSS (MB) |
138.8 |
97.9 |
70.5% |
Max Throughput (req/sec) |
46,172.2 |
123,520.4 |
267.5% |
Max Req/Sec/MB |
332.7 |
1,262.1 |
379.4% |

In a fair comparison (purely remaining on the IO thread - no dispatch), Quarkus more than double its throughput.
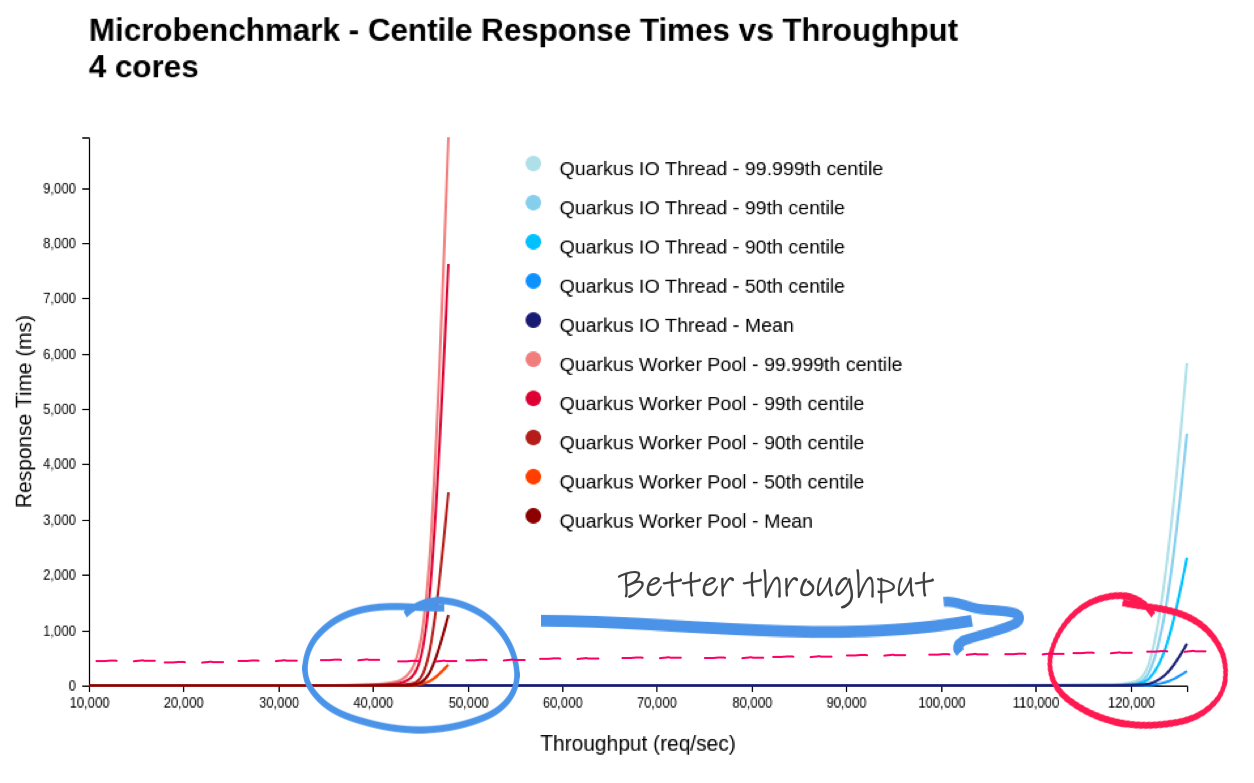
As the generated load tends towards the maximum throughput of the system under test, the response time experienced by the client increases exponentially. So the best system (for the workload) has a vertical line as far to the right as possible. Equally important is to have as flat a line as possible for the longest time. You do not want the response time to degrade before the system reaches maximum throughput.
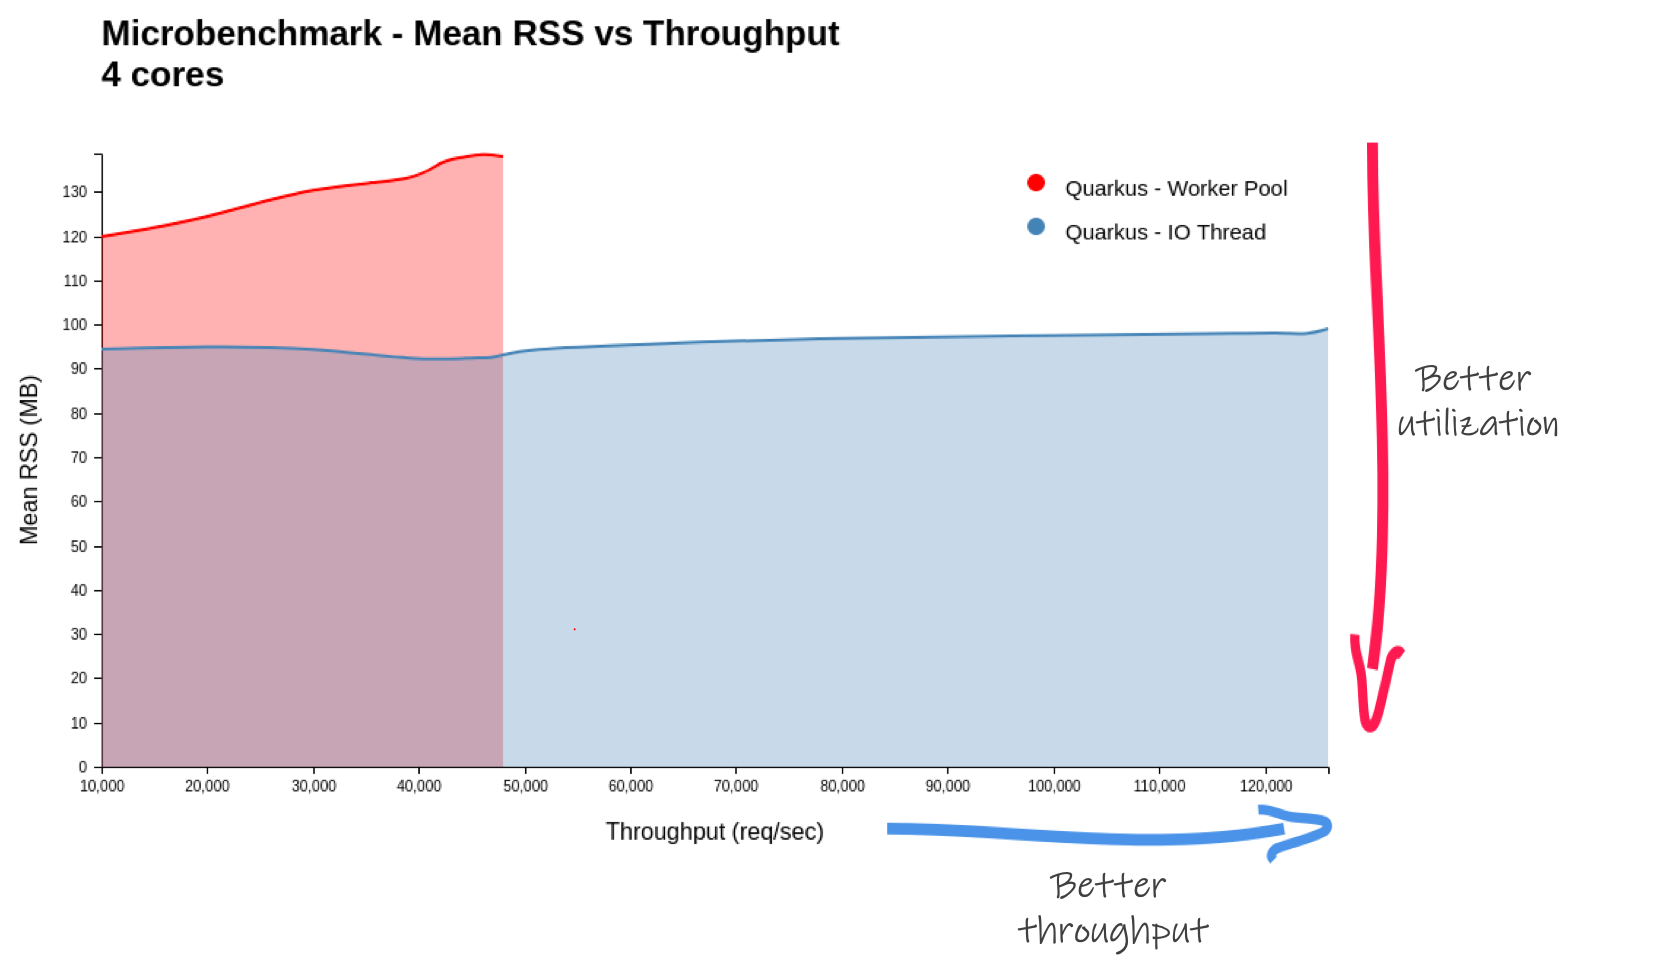
By the way, in the competitor microbenchmark Quarkus is shown as consuming more RSS (more RAM).This is also explained by the worker thread pool being operated whereas the competitor did not have a worker thread pool. The Quarkus Reactive Routes solution (on a pure IO event run) shows a 30% RSS usage reduction.

In this graph, the lower, the better. We see that the pure IO thread solution manages to increase throughput with little to no change to the memory usage (RSS), that’s very good!
Conclusion
Quarkus offers you the ability to safely run blocking operations, run non blocking operations on the IO thread or mix both models. The Quarkus team takes performance very seriously and we see Quarkus as offering great numbers whether you use the imperative or reactive models. In more realistic workloads, the dispatch cost would be much less significant, you would not see such drastic differences between the two approaches. As usual, test as close to your real application as possible.
Mystery solved. Benchmarks are hard, challenge them. But the moral of the story is that in all bad comes some good. We’ve now learned how to run Quarkus applications entirely on the IO thread. And how in some situations that can make a big difference. Remember, don’t block! In fact, Quarkus can warn you if you do so. Oh and we also learned that Quarkus is so fast, it can even beat itself ;p

